Past Projects
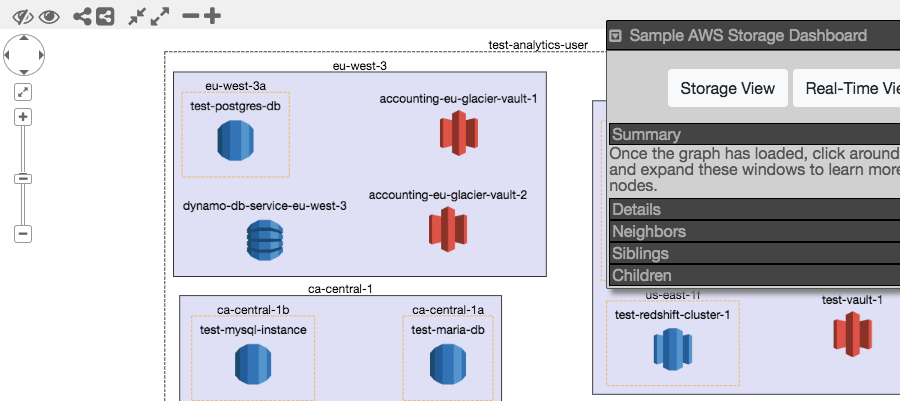
AWS Architecture Visualization
Tool for visualizing, architecting, and improving the security of AWS Cloud-based infrastructures.

Real-Time Sparklines Dashboard
A real-time dashboard for quickly visualizing tends in currency fluctuations for major currencies over the past month. Developed end-to-end to display metrics in real-time. Extracts metrics from the ECB currency API, transforms data using Python's Pandas, visualizes sparklines using d3. Served using nginx and gunicorn via the Flask micro-framework.
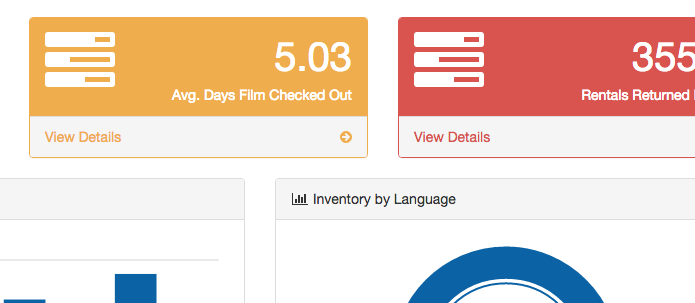
Real-Time Business Dashboard
A dynamic dashboard for visualizing a movie rental company's key business metrics. Developed end-to-end to display metrics in real-time.Extracts metrics from a MySQL database, transforms data using Python, visualizes charts and graphs using d3. Served using nginx and gunicorn via the Flask micro-framework.
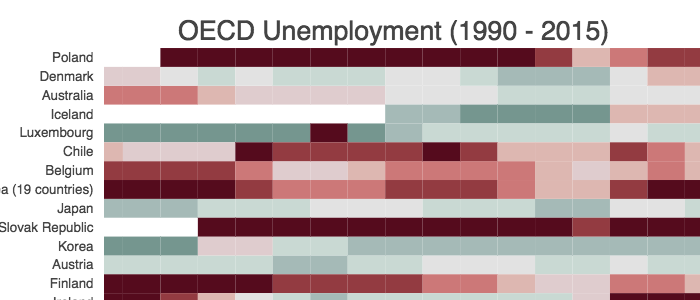
OECD Unemployment Visualization
A dynamic visualization of the unemployment rates in OECD countries over the past 15 years.
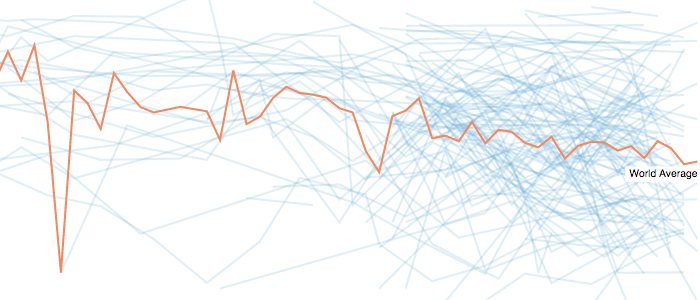
Voter Turnout Visualization
A dynamic visualization of presidential voter turnout by country over time.
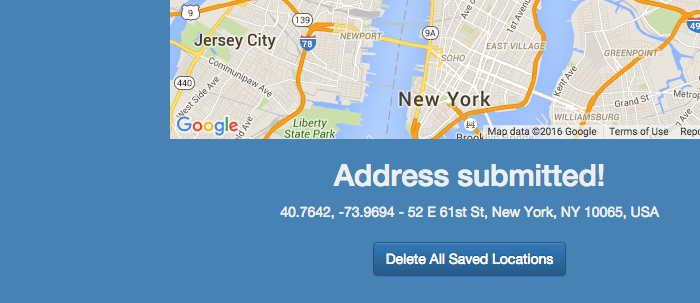
Finders Keepers App
A Django-based application that leverages the Google Maps API to determine wheter a clicked-on location has an address or not.
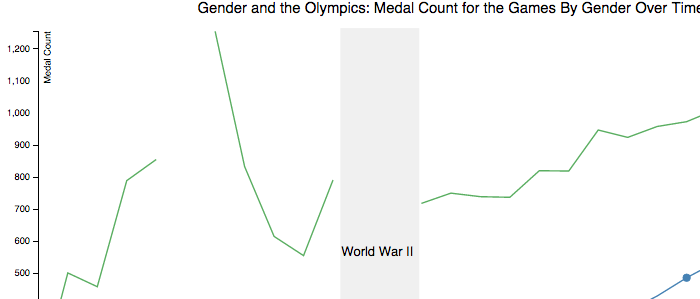
Gender and the Olympics Visualization
A dynamic visualization of the medal count for the Olympic Games by gender over time.

Big Data Ith Degree Connections Finder
A Pig and Bash tool to find ith-degree connections for a list of 1st-degree connections between nodes. This tool uses a Pig abstraction layer to create Map Reduce jobs that allow for scaling to a very large number of connections.
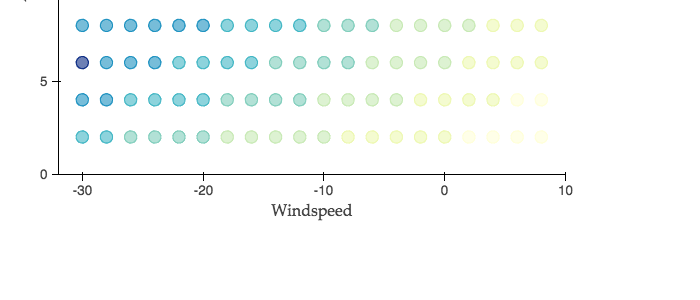
Windchill Visualization
A dynamic, visual representation of the Siple windchill formula.
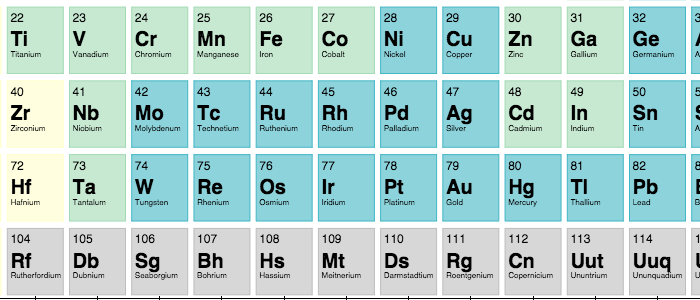
Electronegativity Table
A dynamic representation of Periodic Table electronegativities.

Geo-Based Offline Sales Research
Project undertaken at Twitter to determine the offline sales impact of social networking platforms using a Geo-Based Methodology. Presented at QCon and Grace Hopper.
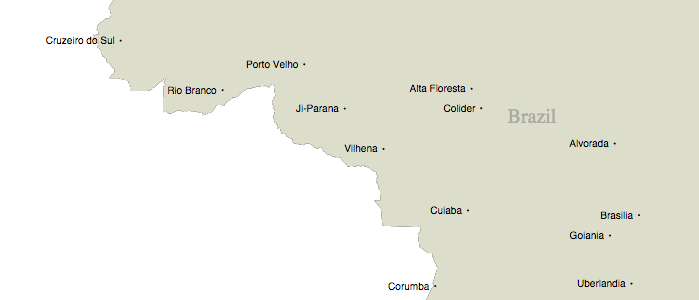
Brazil Map
A map of Brazil showing major cities, created using JavaScript's d3.jslibrary
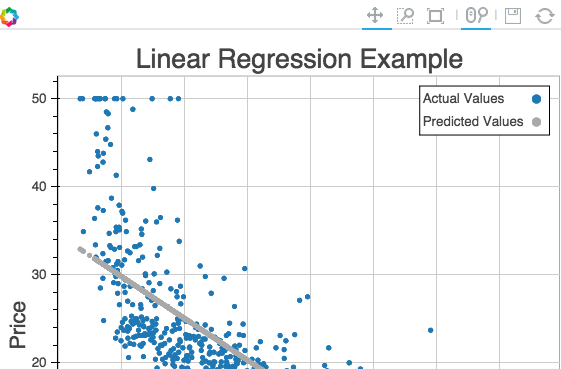
Housing Prices Linear Regression
A simple, dynamic data visualization using Python's Pandas and Bokeh libraries.

Research Funding Predictions Project
I explore the following research question: "What determines the levels offunding that an NSF or NASA-funded project receives?". Using CART, logistic regression, and Random Forest models,I am able to predict whether a research project is likely to have received high levels of fundingwith around 90% accuracy.
Energy Industry Development Prediction
Used R to predict the development of the energy industry usinga patent dataset. Determined whether certain technologies had reached a saturation point.

Inclusion with Identity Dashboard
Created an online, interactive Tableau dashboard for the Inter-AmericanDevelopment Bank that visualized development indicators across various racesand ethnicities in Latin America. Scraped national census data to createdatabase that populated the dashboard.
Social Media Dashboard
Created a real-time, dynamically updating social media dashboard that tracks a Twitter account's key use statistics.